require(tidyverse)
require(oce)
require(highcharter)
require(lubridate)
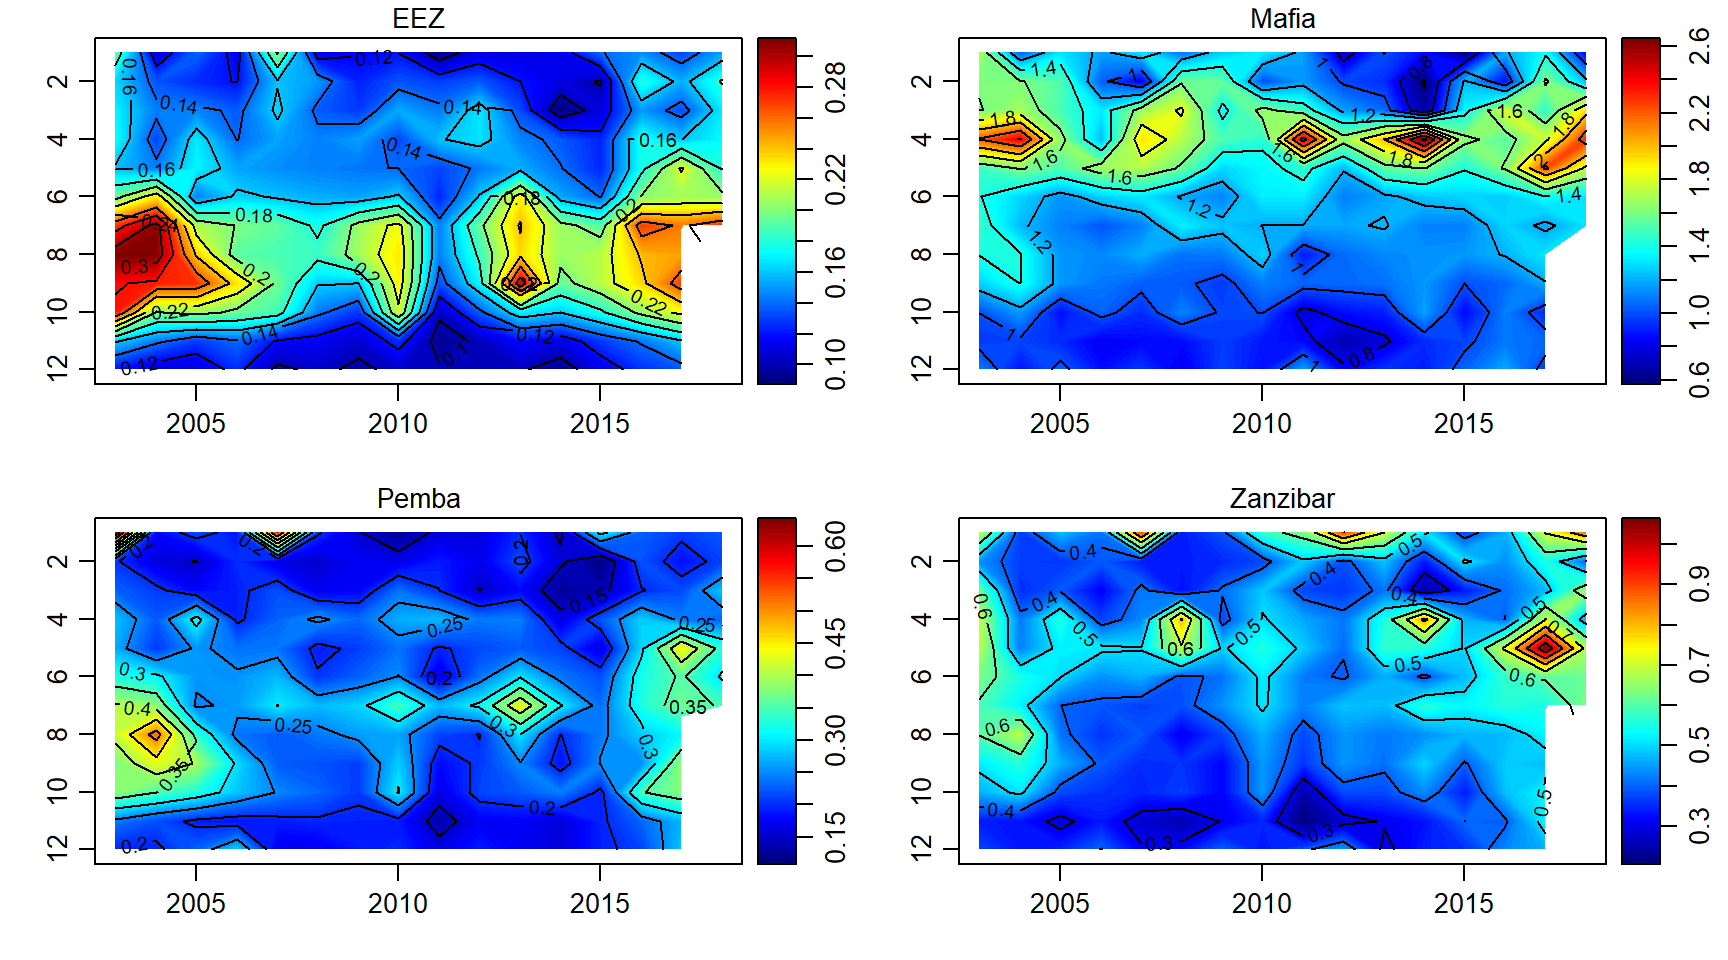
chlorophyll
setwd("e:/Data Manipulation/kuguru/extracted/")

files = dir("./", pattern = "chl_")
sites = c("EEZ", "Mafia", "Pemba", "Zanzibar")
chl = list()
for (i in 1:length(files)){

chl[[i]] = files[i] %>% readxl::read_excel()%>%
  rename(date = 1, year = 2, chl = 3) %>%
  mutate(month = month(date),
         day = 15,
         site = sites[i],
         date = make_date(year = year, month = month, day = day)) %>%
  arrange(date)
}

chl = chl %>% bind_rows()
gg = ggplot()+
  geom_raster(data = chl, aes(x = year, y = month, fill =  chl), interpolate = T, na.rm = TRUE)+
  geom_contour(data = chl, aes(x = year, y = month, z =  chl), col = 1)+
  scale_y_reverse(breaks = 1:12)+
  scale_fill_gradientn(colours = oceColors9A(120))+
  facet_wrap(~site, scales = "free_y")

plotly::ggplotly(gg)
hchart(object = chl%>%filter(site == "Mafia"), "heatmap", hcaes(x = year, y = month, value = chl, group = site))
gb =ggplot(data = chl, aes(x = date, y = chl, col = site))+geom_line()
    plotly::ggplotly(gb)
hchart(object = chl, "line", hcaes(x = date, y = chl, group = site))
month = 1:12
year = 2003:2018

chl.array = array(data = chl$chl, dim = c(length(month),length(year),length(sites)))

par(mfrow = c(2,2))
for (j in 1:length(sites)){
imagep(year, month, chl.array[,,j]%>%t(),filledContour = T, col = oceColors9A(120),  flipy = T, main = sites[j])
contour(year, month,chl.array[,,j]%>%t() , add = T)
}
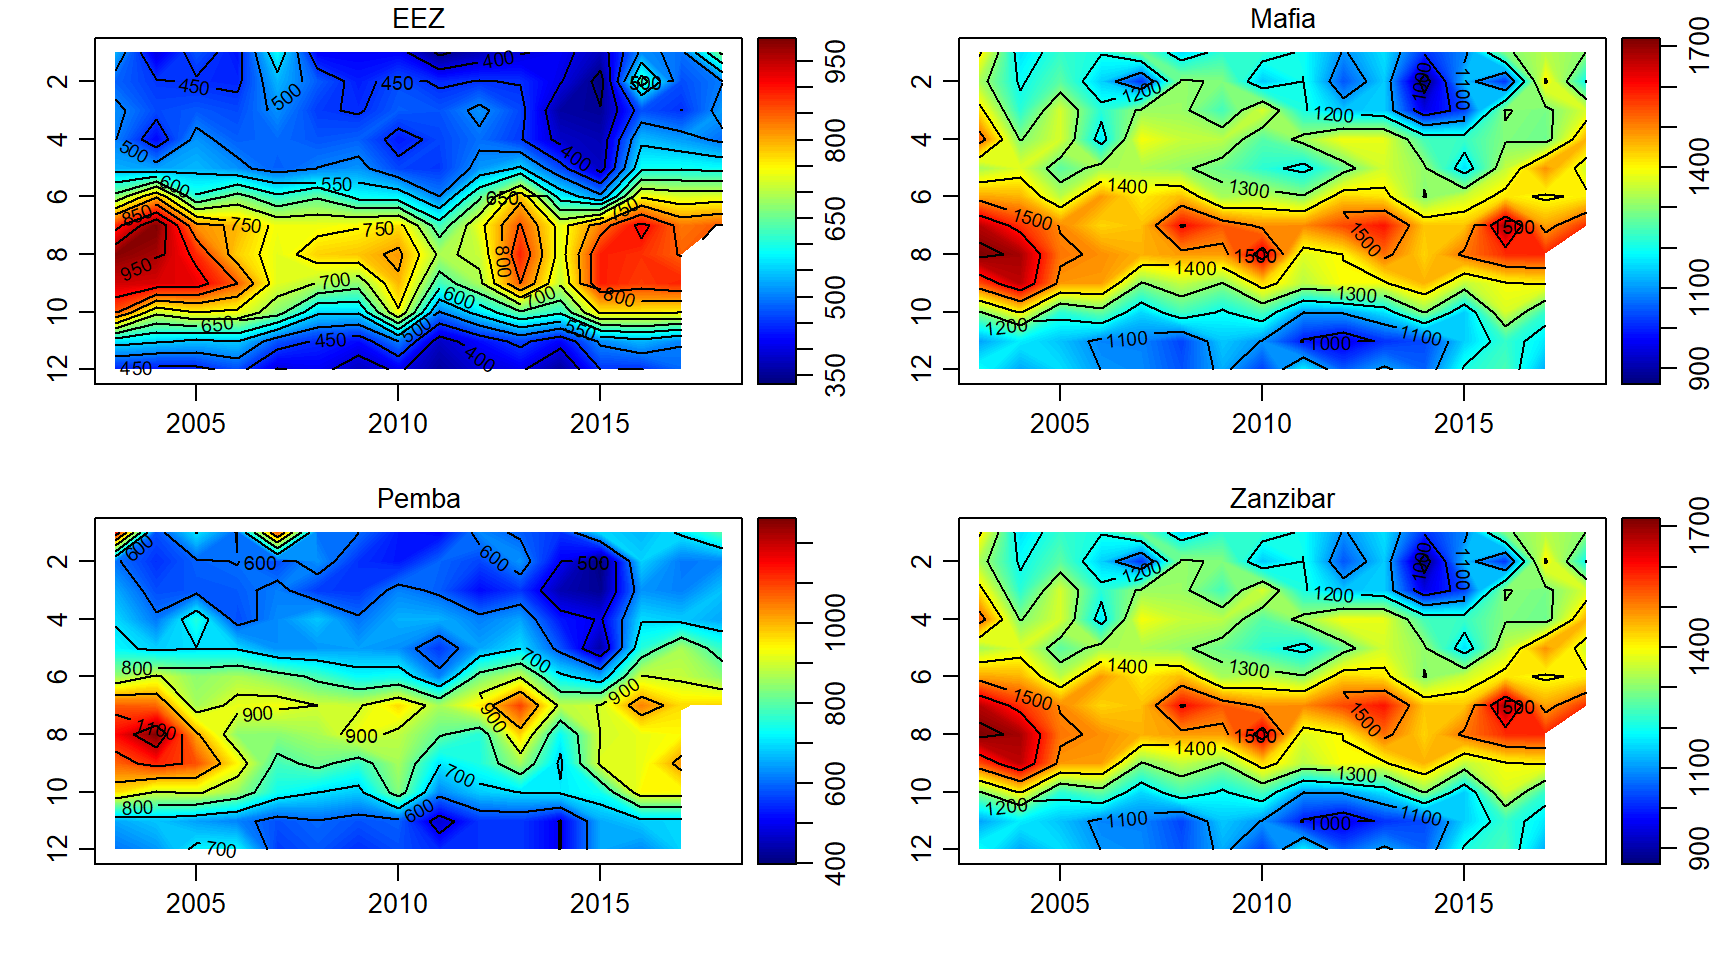
Primary productivity
files = dir("./", pattern = "pp_")
sites = c("EEZ", "Mafia", "Pemba", "Zanzibar")
pp = list()
for (i in 1:length(files)){

pp[[i]] = files[i] %>% readxl::read_excel()%>%
  rename(date = 1, year = 2, pp = 3) %>%
  mutate(month = month(date),
         day = 15,
         site = sites[i],
         date = make_date(year = year, month = month, day = day)) %>%
  arrange(date)
}

pp = pp %>% bind_rows()
gg = ggplot()+
  geom_raster(data = pp, aes(x = year, y = month, fill =  pp), interpolate = T, na.rm = TRUE)+
  geom_contour(data = pp, aes(x = year, y = month, z =  pp), col = 1)+
  scale_y_reverse(breaks = 1:12)+
  scale_fill_gradientn(colours = oceColors9A(120))+
  facet_wrap(~site, scales = "free_y")

plotly::ggplotly(gg)
hchart(object = pp%>%filter(site == "Mafia"), "heatmap", hcaes(x = year, y = month, value = pp, group = site))
gb =ggplot(data = pp, aes(x = date, y = pp, col = site))+geom_line()
    plotly::ggplotly(gb)
hchart(object = pp, "line", hcaes(x = date, y = pp, group = site))
pp.array = array(data = pp$pp, dim = c(length(month),length(year),length(sites)))

par(mfrow = c(2,2))
for (j in 1:length(sites)){
imagep(year, month, pp.array[,,j]%>%t(),filledContour = T, col = oceColors9A(120),  flipy = T, main = sites[j])
contour(year, month,pp.array[,,j]%>%t() , add = T)
}
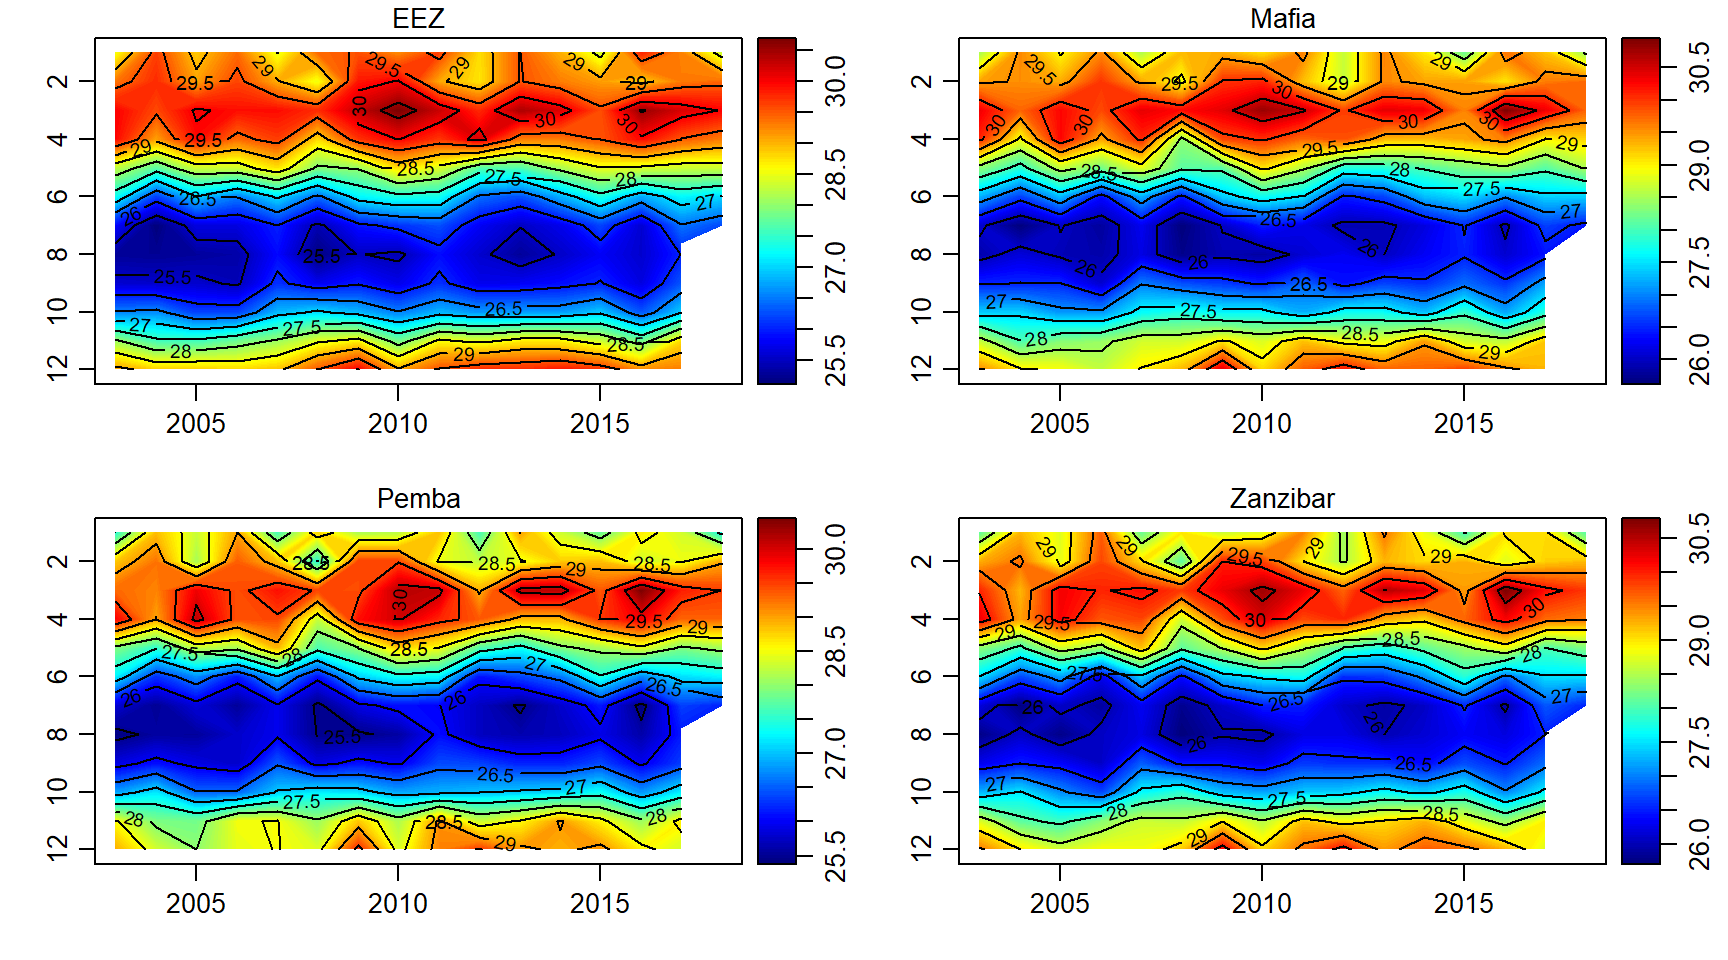
Temperature
files = dir("./", pattern = "sst_")
sites = c("EEZ", "Mafia", "Pemba", "Zanzibar")
sst = list()
for (i in 1:length(files)){

sst[[i]] = files[i] %>% readxl::read_excel()%>%
  rename(date = 1, year = 2, sst = 3) %>%
  mutate(month = month(date),
         day = 15,
         site = sites[i],
         date = make_date(year = year, month = month, day = day)) %>%
  arrange(date)
}

sst = sst %>% bind_rows()
gg = ggplot()+
  geom_raster(data = sst, aes(x = year, y = month, fill =  sst), interpolate = T, na.rm = TRUE)+
  geom_contour(data = sst, aes(x = year, y = month, z =  sst), col = 1)+
  scale_y_reverse(breaks = 1:12)+
  scale_fill_gradientn(colours = oceColors9A(120))+
  facet_wrap(~site, scales = "free_y")

plotly::ggplotly(gg)
hchart(object = sst%>%filter(site == "Mafia"), "heatmap", hcaes(x = year, y = month, value = sst, group = site))
gb =ggplot(data = sst, aes(x = date, y = sst, col = site))+geom_line()
    plotly::ggplotly(gb)
hchart(object = sst, "line", hcaes(x = date, y = sst, group = site))
sst.array = array(data = sst$sst, dim = c(length(month),length(year),length(sites)))

par(mfrow = c(2,2))
for (j in 1:length(sites)){
imagep(year, month, sst.array[,,j]%>%t(),filledContour = T, col = oceColors9A(120),  flipy = T, main = sites[j])
contour(year, month,sst.array[,,j]%>%t() , add = T)
}